Hidden Safety Problems Keep Denver Kids From Walking and Biking
In this guest post, Wes Marshall, a professor of civil engineering at the University of Colorado Denver, reveals Denver-based research showing that crash data hides places where kids want to walk and bike. Related papers show how to identify places where kids already are, and how to create safer streets where they want to go — instead of waiting for them to get run over by cars before intervening. The above video helps to explain the conclusions.
One of the key tenets of Vision Zero is that we need to be more data-driven in responding to the public health crisis we have on the roads. Denver’s Vision Zero Action Plan, for instance, includes “improve data and be transparent” as one of their five themes and “processes and data” as one of their three working groups. A data-driven approach to improving safety makes perfect sense, especially given how traffic engineers have long prioritized capacity and efficiency over safety.


Hot-Spot Crash Analysis
What do we do with maps like these? Typically, that is where we’d want to prioritize our efforts and investments if we want to best improve our safety outcomes.
But do they really tell the whole story when it comes to pedestrian and bicyclist safety?
Not even close.
There is a laundry list of potential issues. One is that any such map will inevitably highlight downtown Denver, in part because that is also where most of the pedestrians and bicyclists are. To resolve that, we’d need to take exposure into account. In other words, how many pedestrians and bicyclists are out there? With that, we could calculate crash rates instead of just looking at the raw number of crashes.
I sometimes use this picture of a person riding a bicycle in flip-flops in the middle of the Southeast Expressway in Boston (I-93 is a major, elevated, limited-access highway) to get this point across. I joke this person simply looked at the lack of bicycle crashes on this highway and assumed it was the safest road for bicyclists in town.

Another known issue has to do with the systematic underreporting of active transportation crashes. A lot of folks don’t want to call the police unless they truly have to, so if we look at our conventional crash data – which is all police-reported – we are definitely not seeing the whole story. This is particularly problematic with minority populations as well as with immigrant communities. For whatever reason, we also limit our police-reported crash data to just crashes where there is a moving motor vehicle involved. If a bicyclist hits a pedestrian, we don’t collect it. If a bicyclist gets doored by a driver exiting their parked car, we don’t collect that data either.
Another issue is that these crash reports were designed for motor vehicle crashes. A couple years ago, we were looking at bicyclist crash data from eight communities from across the county and found some pretty bizarre trends. Here is a quote from that paper, which was led by Geoff Gibson of Portland State University:
“San Diego County recorded its collision type data as such: head-on, sideswipe, rear end, broadside, hit object, overturned, vehicle/pedestrian, other, and not stated. 291 of San Diego County’s recorded bicycle crashes were marked ‘overturned,’ but there was no mention of whether this was for the bicycle or if there were 291 overturned vehicles hitting cyclists. This makes figuring out what actually occurred in the crash much more challenging.”
We are pretty sure that San Diego didn’t have 291 cars land upside down on top of bicyclists. We are also pretty sure that classifying a bicycle on its side as an “overturned” vehicle wouldn’t really help a data-driven approach very much.

One of the most prevalent undiagnosed road safety issues I see is hidden a bit deeper. Even worse, this problem can lead us to thinking that conventional engineering interventions have actually improved pedestrian and bicyclist safety when the exact opposite may be true.
What happens is that we make a road so, so unsafe that nobody wants to walk or bike there in the first place. Then we look at the crash data, see that the number of pedestrian and bicyclist crashes has gone down, and declare victory.
It is these roads – that are so unsafe that very few people would walk or bike there – that end up getting missed in the typical data-driven analysis.
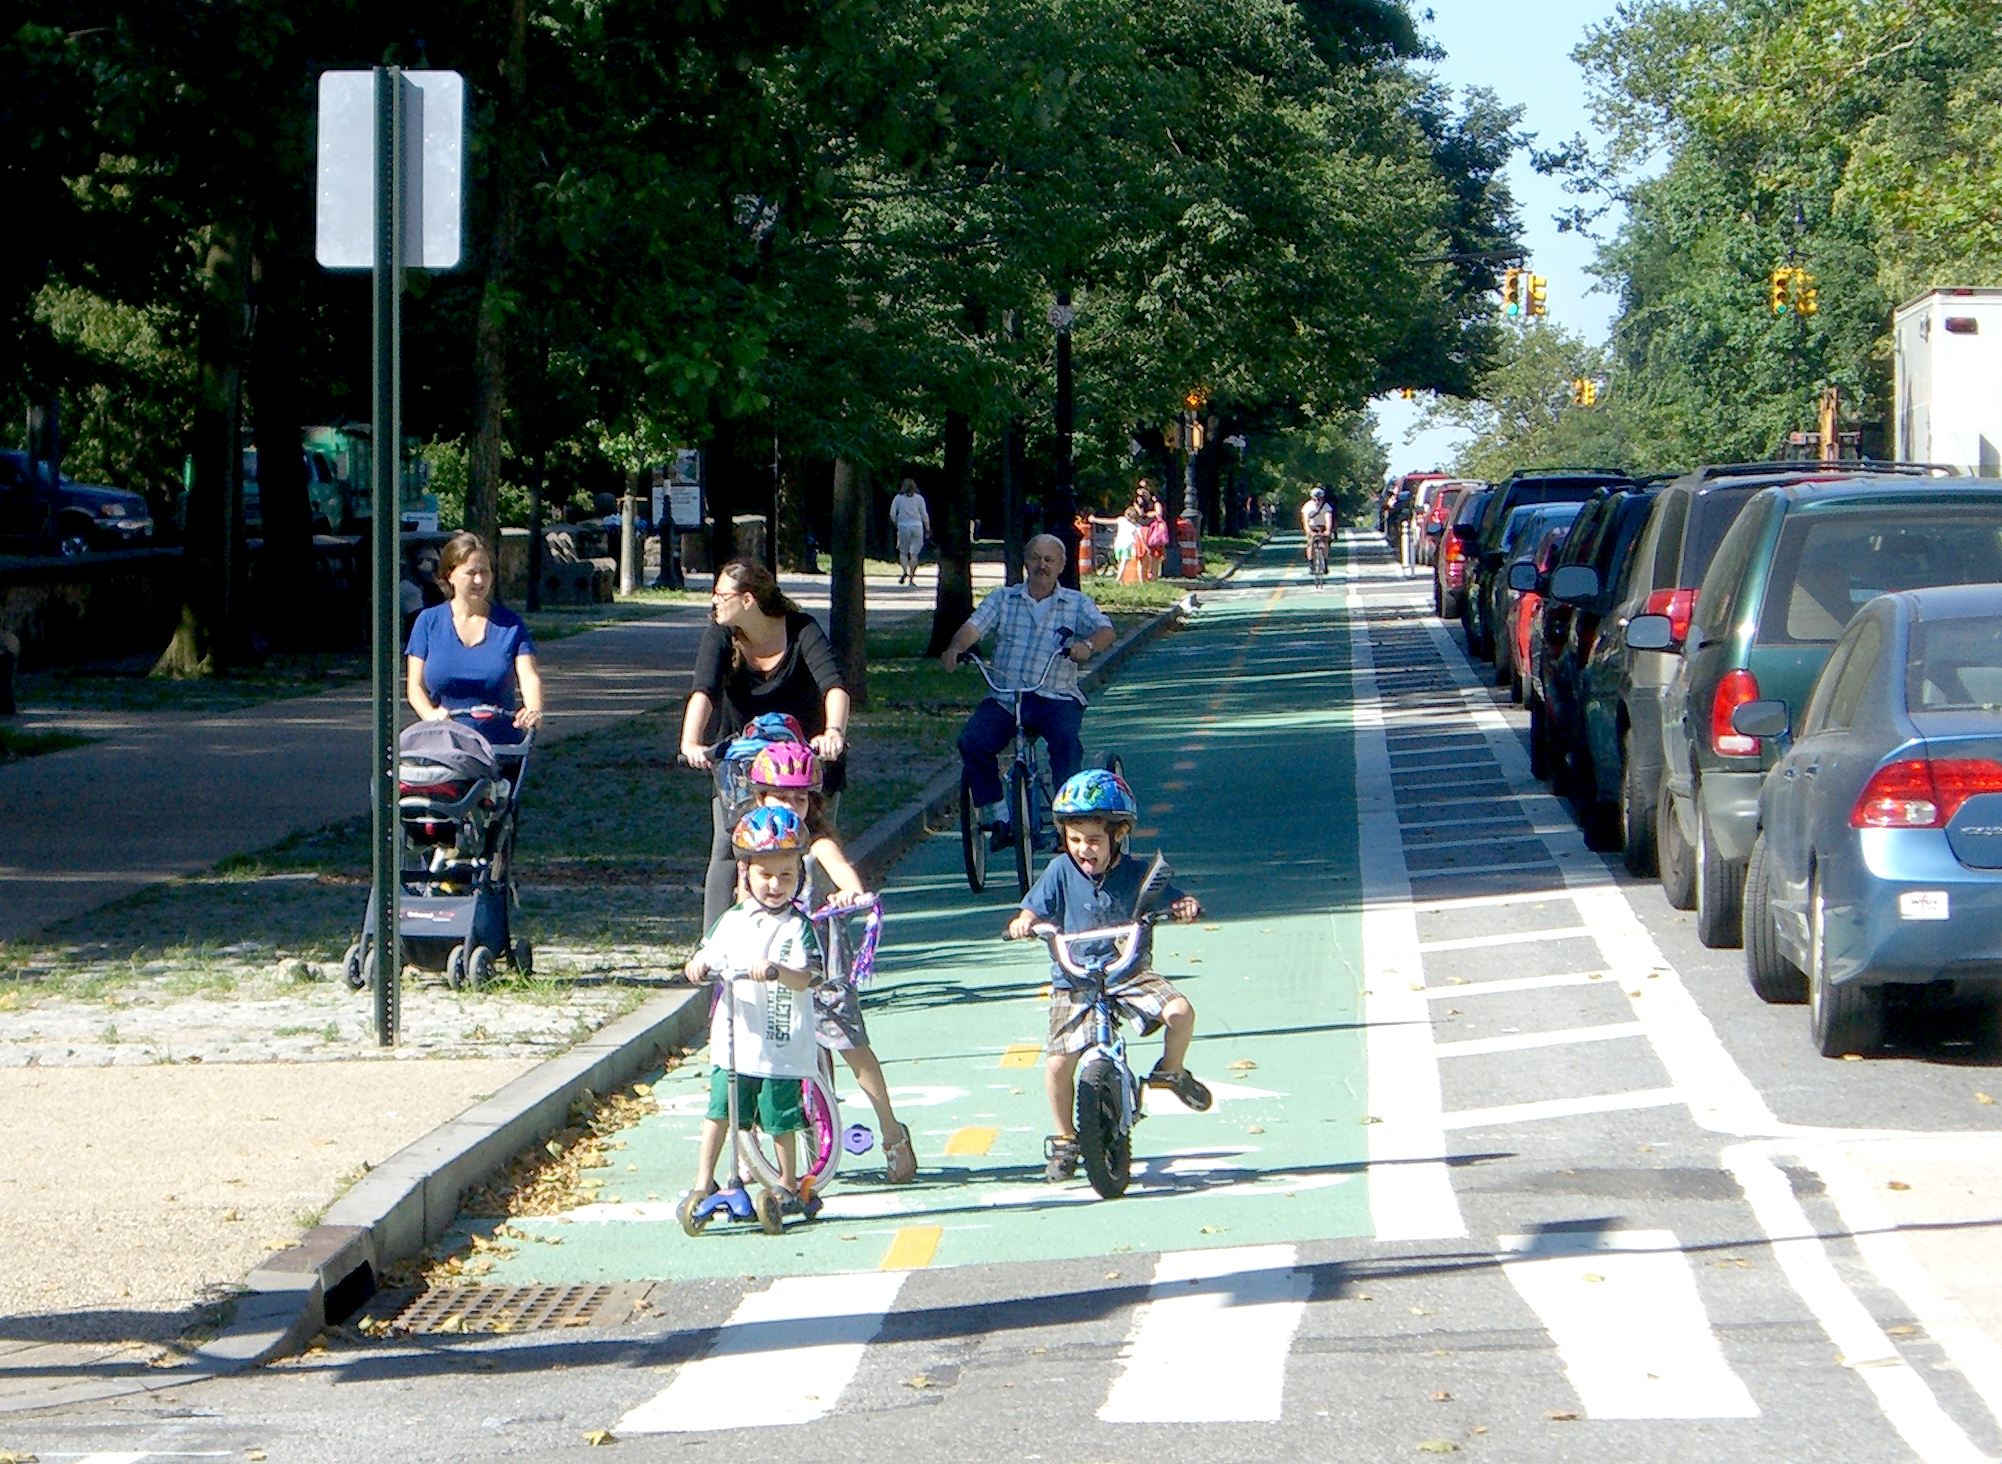
To try to find the roads where people would want to walk or bike but don’t because of perceived safety concerns, my former PhD student Nick Ferenchak (who is now an Assistant Professor at the University of New Mexico) and I decided to focus on kids.
Click on the video at the top to hear more about those studies.
A quick synopsis: we first conducted a survey and asked over 800 Denver parents about the types of streets where they would let their kids walk or bike. We then estimated the routes that Denver kids could walk or bike to school and looked to see if there were any of these so-called “barrier” roads in the way. If there were, we rerouted the kids to see if they could get to school without having to walk or bike on such a barrier road. If they could do so without adding too much distance, great. If not, then we counted that walking/biking trip as potentially suppressed. We then mapped where all these suppressed walking/biking trips were located.
What did we find? The image below compares the results of a typical, reactive crash data analysis with our proactive analysis for bicyclists.

While we also see that downtown is a problem, we find new areas of concern that didn’t turn up in the conventional crash analysis. We can even zoom in to see which streets are most problematic, and which streets might look problematic but don’t actually inhibit kids from walking or bicycling to school (see the streets highlighted in yellow below). Might we want to fix such a street in the future? Of course, but our thinking is that one way to better prioritize our Vision Zero efforts would be to focus first on kids, and to do so in a way that doesn’t require us waiting around for enough kids to get run over by cars before intervening. If we ask where kids are and where kids are going, we can look to make sure they can get there safely – and do so in a proactive instead of a reactive manner.
Bigger picture – if we first dedicate ourselves to making our city safe for kids to walk and bike while also including ADA accessibility, then we are well on our way to making our city safer for everyone. And if we don’t want Vision Zero to end up as more of the same business as usual, then we need to take a fundamentally different approach to how we understand and attack our road safety problems… and sometimes that means looking beyond the data.

For more information, take a look at some of our research papers on this subject:
- Suppressed Child Pedestrian and Bicycle Trips as an Indicator of Safety: Adopting a Proactive Safety Approach
- Redefining the Child Pedestrian Safety Paradigm: Identifying High Fatality Concentrations in Urban Areas
- Equity Analysis of Proactively- vs. Reactively-Identified Traffic Safety Issues
- Or check out Don Kostelec’s recent blog post about this
Support the nonprofit mission of Streetsblog Denver. Give $5 per month.
Streetsblog has migrated to a new comment system. New commenters can register directly in the comments section of any article. Returning commenters: your previous comments and display name have been preserved, but you'll need to reclaim your account by clicking "Forgot your password?" on the sign-in form, entering your email, and following the verification link to set a new password — this is required because passwords could not be carried over during the migration. For questions, contact tips@streetsblog.org.