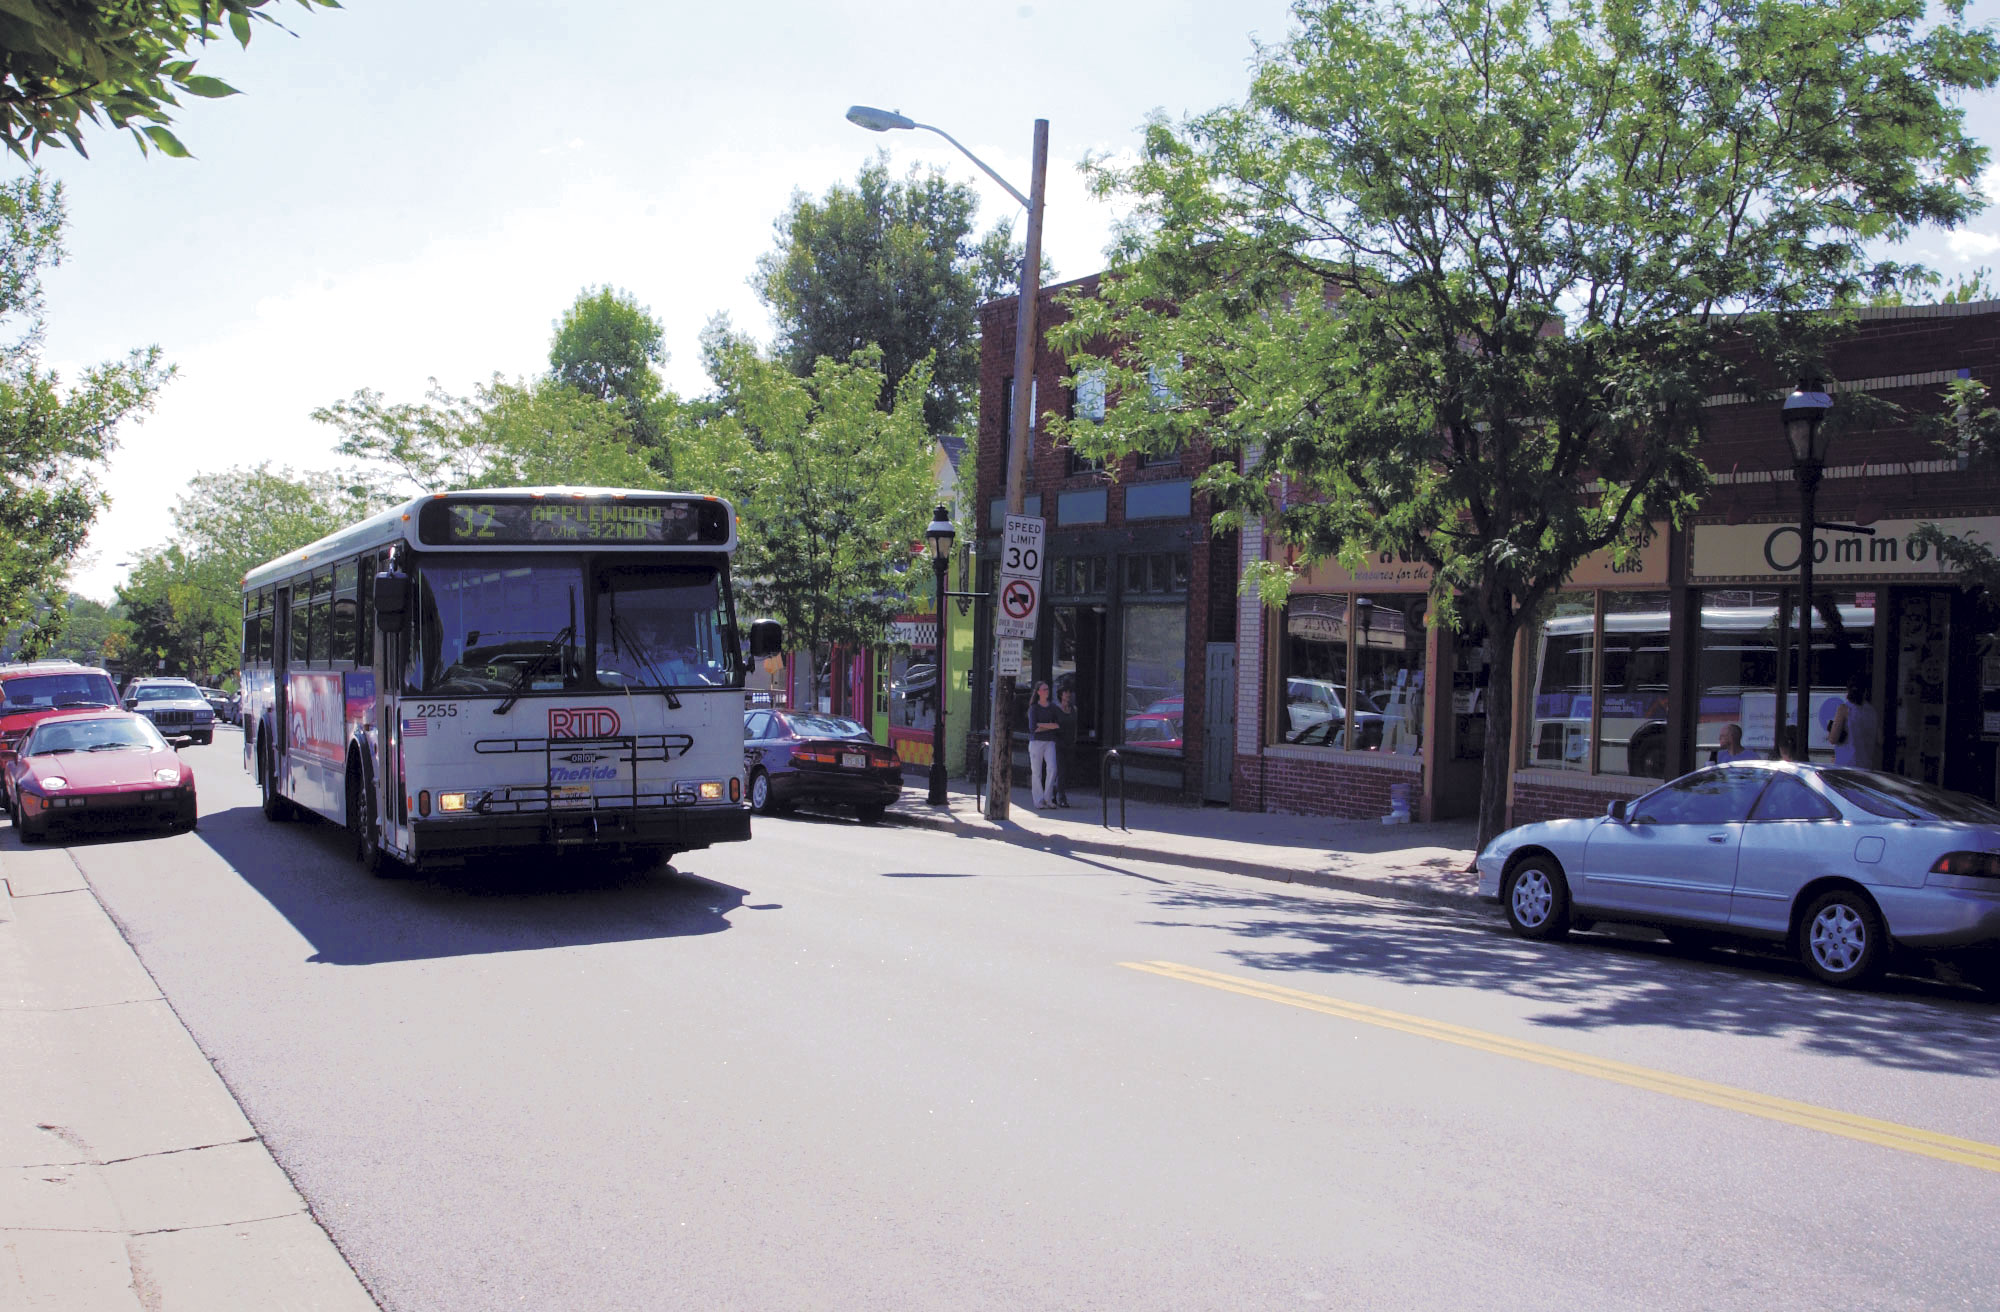
Why Is Bus Ridership Plummeting in Denver? New Data Tool Offers Insights.
Disclosure: This story is about Transit Insights, a tool from TransitCenter, a New York-based foundation that provides funding to Streetsblog Denver.
Want to know why people are ditching the bus in Denver while ridership is growing in Seattle, Houston and Columbus?
Now there’s a way for activists, academics and policymakers to compare what’s not working in one city to what’s driving success in other places. It’s possible with Transit Insights, a new web-based tool that makes it easier to map, visualize and crunch data from the National Transit Database, the U.S. Census and route maps at Transitland. The idea is that easier access to practical information will allow better decisions to be made in the future, says a blog post from TransitCenter, the foundation that created the tool.
“Understanding why ridership is rising in some places but not in others is critical to formulating effective transit policy,” according to the post. “To gain that understanding, advocates, researchers, and policy makers need access to useful data on local ridership trends, service characteristics and demographics.”
In Denver, bus service cuts, investments in rail, fare hikes and gentrification are among the factors driving down transit ridership, all insights I learned while getting a quick overview of the tool this afternoon with Mary Buchanan, a research associate at Transit Center.
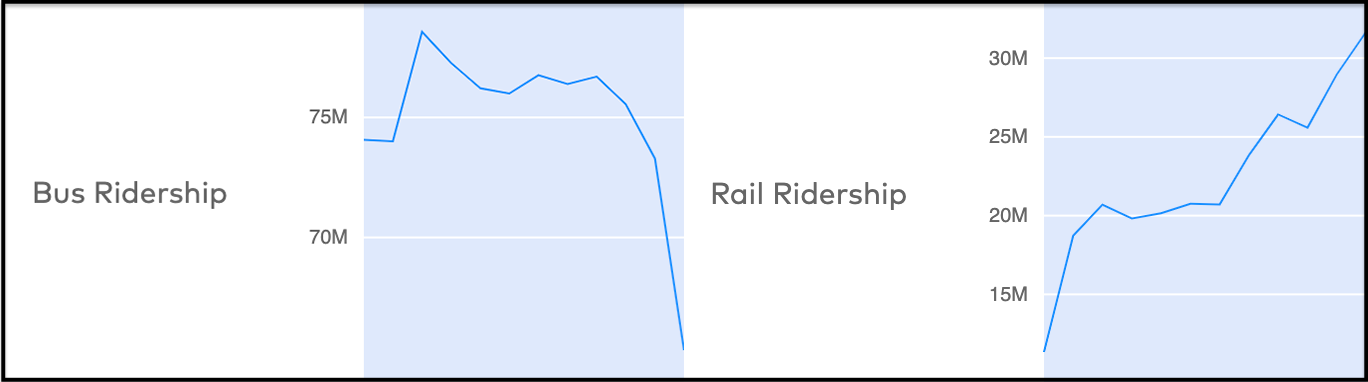
“It’s a tale of two modes,” she said. “In Denver, we see that bus ridership is rapidly decreasing. And at the same time, rail ridership has increased.”
In 2017, RTD provided some 65 million trips on buses compared to just 32 million on rail. Yet as the agency increases rail service, it has cut bus service multiple times in recent years, including in January. Another round of cuts will come to bus riders on May 19.

“As the agency is opening up new rail lines, RTD is not investing resources in its core bus network,” said Buchanan. But the bus network “provides about two times as many rides annually as the rail network.”
With RTD reducing the frequency and reliability of service for what now remains a majority of its riders, it is also asking more from them. From 2006 to 2017, RTD fares increased 49 percent — compared to a nationwide average of just 17 percent over the same period, according to the tool. And now, after January’s price bump, which is not included in the statistics just cited, the agency’s fares are among the highest in the nation.
“For riders there has to be some sort of tradeoff. If you’re going to be paying higher fares you’d hope you you’d be receiving better service,” said Buchanan. “That’s not really the case at RTD.”

The city’s changing demographics also play a part in declining ridership.
As wealthier people move into the urban core, many bring their cars and push out lower-income transit riders. In the Census tract that roughly corresponds with the Five Points neighborhood, for example, Census data shows household incomes going up 36 to 38 percent between 2010 and 2016, along with the number of people who own cars going up between three and 15 percent. Meanwhile, those who were forced out seem to be moving to places with less transit service.
“There are many neighborhoods and communities outside of the urban core where the share of households without vehicles is increasing,” Buchanan said. “Maybe it is a population that relied on transit when they were closer into the city and now are living without a vehicle in a neighborhood that does not have as good of transit access.”
The foundation launched a public beta of Transit Insights last week and this story shows a handful of discoveries made during a half-hour phone conversation. There’s more to explore, and that’s exactly what TransitCenter would like people to do. The organization welcomes feedback to guide refinements to the tool, which users can offer via an email to ridership@transitcenter.org.
This story was written in a matter of hours and RTD officials did not have time to coordinate a response in time for publication of this story.
Streetsblog Denver informs the movement for sustainable transportation and a livable city. Give $5 per month.
Streetsblog has migrated to a new comment system. New commenters can register directly in the comments section of any article. Returning commenters: your previous comments and display name have been preserved, but you'll need to reclaim your account by clicking "Forgot your password?" on the sign-in form, entering your email, and following the verification link to set a new password — this is required because passwords could not be carried over during the migration. For questions, contact tips@streetsblog.org.