RTD at 50: The 50 Most Fascinating Facts & Stats

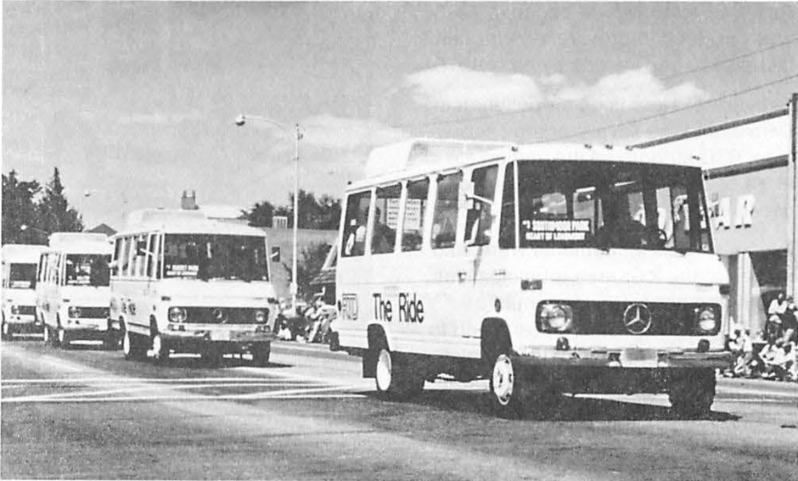
This year the Regional Transportation District celebrates its 50th anniversary. From its first pilot project (the Longmont Mini) to providing nearly 100 million rides last year, Streetsblog gathered 50 the agency’s most fascinating facts and stats. (Actually it’s 52, but 50 sounds better).
History
Source: RTD
- 1969: The Colorado General Assembly created RTD
- 1978: Disability rights activists block buses for two days at Colfax & Broadway (5280)
- 1982: The 16th Street Mall opened and the Free MallRide started service
- 1994: The D-Line, RTD’s first light rail line, opened
- 2014: Union Station reopens as a regional transit hub

5 most popular bus lines
Source: 2017 boardings data, compiled by Streetsblog
- 10,739,866: Free MallRide
- 6,976,848: 15 + 15L East Colfax
- 3,083,298: FF Flatiron Flyer (Denver – Boulder)
- 2,862,361: 0 + 0L South Broadway
- 2,536,885: 16 + 16L West Colfax
5 most popular rail lines
Source: 2017 boardings data, compiled by Streetsblog
-
Ten years after voters approved FasTracks, Union Station reopened as a regional transit hub. Photo: RTD 6,649,495: A: University of Colorado A-Line (airport)
- 5,428,387: D: 18th & California to Littleton-Mineral Station
- 4,794,569: H: 18th & California to Florida Station
- 4,526,767: E: Union Station to Lincoln Station
- 4,262,712: W: Union Station to JeffCo Govt. Ctr.-Golden Station
Total transit boardings
Source: RTD
- 97.6 million in 2018, a 6.8% decline since 2014
- 104.2 million in 2014
- 34 boardings per capita in 2017, a 13.5% decline from 2008
- 38.6 boardings per capita in 2008

Transit vs. driving alone
- 73%: Trips in Denver completed by someone who drives alone (source)
- 60%: Denver’s unrealistic goal for single-occupancy vehicle trips by next year (source)
- 39.3% of downtown Denver workers ride transit to work, 39% drive alone (RTD)
- 19% of downtown Boulder workers ride transit to work, 58% drive alone (RTD)
Fares & per-ride costs
Source: RTD
-
RTD used tokens for fare payment from 1979 through 2017. 40¢: Fare for a Denver Tramway ticket in 1969 (pre-RTD)
- $2.76: Amount a 40¢ fare would cost in 2019 dollars (calculator)
- $3: Amount a regular adult local fare cost in 2019
- $9.50: Average amount each ride cost RTD in 2016 (source)
- $6.50 Amount RTD subsidizes (source)
Money
Source: 2017 budget
- $140.2 million in fares collected in 2017 (14.2% of revenues)
- $598 million in sales and use tax revenue in 2017 (60.4% of revenues)
- $626.1 million operating budget in 2017
Employees
Source: RTD
- 1,975: Union-represented bus and train operators and mechanics
- 953: Operators paid by private contractors
- 655: FlexRide and Access-A-Ride drivers paid by private contractors
- 888: salaried management and administrative employees

Transit mix (by vehicle service hours)
Source: RTD
- 72%: Bus (69% of all transit boardings)
- 7%: Rail (31% of all transit boardings)
- 20%: FlexRide, Access-A-Ride
FasTracks
Source: RTD
- 2004: Voters approved a sales tax to build 122 miles of rail
- 2018: 58.5 miles of rail completed
Trains
Source: RTD
- 172: Electric light rail vehicles
- 66: Commuter rail vehicles
- 58.5: Miles of track
- 54: Stations

Buses
Source: RTD
- 1,035: Buses, all have wheelchair lifts
- 5 million: Gallons of ultra-low sulfur diesel consumed per year
- 36: Free MallRide buses, 100% electric vehicles started service in 2016
- 10,053: Bus stops
142 Bus Routes
Source: RTD
- 88: Local routes
- 16: Limited routes
- 20: Regional routes
- Other routes (SkyRide, Free MallRide, Free MetroRide, Art Shuttle, HOP, Senior Shopper, BroncosRide, CU/CSU football rides, etc.)


