Data Geek: Blogger Tracks 102 RTD Train Rides, 74% Were Not on Time
With so many trains behind schedule, RTD is messing up Ryan Dravitz' life

This guest post was originally published on the Denver Urbanism Blog where Ryan Dravitz is a contributor.
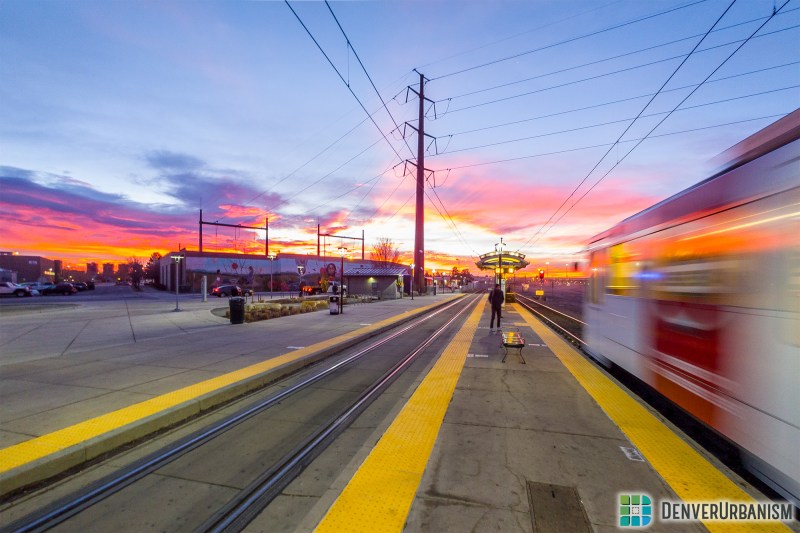
It was a snowy January morning. I knew that all methods of transportation would be a mess and that my commute, if I decided to drive, would take well over two hours. So, I did what I always do. I bundled up, put some boots on, and started my quarter-mile hike through the snow to the Alameda Station. I check the Transit app on the way to the station and see that the train is going to be on time.
As I’m waiting for the train at the station, the E line that was supposed to arrive on time ended up to be a C line that I couldn’t take. Then a D line, H line, and then nothing for over 10 minutes. Silence. My app didn’t have an alert, and the signs at the station posted the scheduled times with no announcements. By the time the E line came, my backpack was soaked, lunch was wet, I was very late to work, and there were many unhappy passengers. This gave me the motivation to start tracking the reliability of RTD’s rail system.
I wish I could start this post by stating, “After tracking 102 train rides, RTD’s rail system is, for the most part, on time and serving its passengers without frustrations or delays.” Unfortunately, that statement is far from the truth. At best, from the sample data set I am presenting to you, RTD’s rail reliability clocks in at 36%. Sounds a bit outlandish, right?
Throughout this post, we will be exploring the data that backs up the above statement along with the methodologies used for tracking the rail system’s on-time performance. Let’s begin with a detailed explanation of how I collected the data and came up with the final reliability result. You can follow along with the screenshots below, which show just a small sample (my first 11 trips) of the overall data set. You can access the full spreadsheet of data here. In these tables, I’ve highlighted in yellow the columns being discussed in that section.
Scope of data
Living right off the Alameda Station, I mainly commute to the office via the E or F line and also use the rail system to go Downtown. I tracked every single ride I took from February 20, 2019 to May 9, 2019, totaling 102 rides. Every tracked ride was on light rail; no commuter rail or bus rides were tracked.
Pickup and drop-off
These columns are pretty straightforward. RTD trains run on a schedule so the Scheduled Pick-up and Scheduled Drop-off is the actual scheduled time that is posted at the stations and on RTD’s website.
Actual Pick-up and Actual Drop-off is when the train actually arrived at the station. Train arrival is a bit open to interpretation. Is it when the train crosses the back of the station, or when the doors open? The times documented in these columns were when the train came to a full stop and the doors opened. As a typical passenger, this is when you would expect your pick-up time to be. But, what if that’s not the standard definition of “pick-up” and RTD uses something else? This possible discrepancy is built into the result—more on that later.
Time differences
These columns give us the numbers that contribute to the reliability calculation. Pick-up Difference and Drop-off Difference are pretty self-explanatory. This is the difference between the scheduled and actual pick-up times. Total Difference (Reference Only) is the addition of these two differences. This column is for reference only and doesn’t contribute to any reliability calculations.
Total Difference (Impact), highlighted in gray, is the most important column on the entire spreadsheet as it is the actual calculated time impact a passenger experiences. This is taken from the greatest of differences from either the Pick-up Difference or Drop-off Difference columns. This can also be calculated with various interpretations of “impact”, so here are a few examples of my methodology:
- The train picks me up 5 minutes late and drops me off 5 minutes late. The total impact would be 5 minutes as I would arrive at my destination 5 minutes late.
- The train picks me up on time but drops me off 2 minutes late. The total impact would be 2 minutes as I would arrive at my destination 2 minutes late.
- The train picks me up 3 minutes late but drops me off on time. The total impact would still be 3 minutes because it was originally 3 minutes late in picking me up. Even though I arrived at my destination on time, I was still waiting an extra 3 minutes. With adverse weather, 3 extra minutes can be the difference between being dry or drenched with rain or snow.
Miscellaneous data
The Announcements column reports announcements made at the stations, over the train PA, or via real-time data apps. Real-Time Data Accurate is straightforward: tracking if the real-time data shown in the apps was accurate. I would check the real-time information 5 to 10 minutes before the scheduled pick-up or drop-off time. Fare Checked is if my fare was checked on the train.
Real-time data was accessed using both the Transit App and RTD’s Next Ride service.
Special circumstances
When a train doesn’t show at all, or when a train departs the station before its scheduled departure time, riders are very negatively impacted. Unfortunately, I experienced these situations and included them in the data set, which decreases the reliability percentage. In a perfect transit system, when trains are running late or not coming at all, an announcement would be made at the station and through transit apps. In this case, there was not a single announcement from RTD about a late-running or cancelled train.
I also experienced a single ride that I recorded in the data set as Didn’t Take. Here’s what happened. I was waiting for an F train. It didn’t arrive on time, and while waiting for this late-running F train, the next-scheduled E train pulled into the station, so I took it instead. This counts as a no-show for the F train because I left on the E train before I could determine if the F train arrived or not.
Notes
You will want to access the spreadsheet to see the data explained in this section. The Notes column in the spreadsheet contains a variety of observations I made while riding the train during this assessment. Examples of these observations include abrupt stops between stations, non-functioning digital signs at stations, notes about weather (bomb cyclones!) and the like.
On multiple occasions, the PA announcements were incorrect and inconsistent with what was actually happening on the train. For example, the “doors-closing” announcement was repeated, alarmingly, in between stations while the train was going full speed. On one ride in particular, the “next-station” announcements were off by a station for the entire journey. I hope no one from out of town was on that train and got off at the wrong station.
More notes include trains leaving the station early and more of me complaining about the weather; it was a rough winter for public transit riders. However, the most exciting observation is that RTD is replacing their light-rail fleet with new cars! These new cars are great as they have a more modern feel and no more awkward face-to-face seating. Here are some interior pictures of the new cars.
Tolerances
As mentioned above, I have built in a tolerance to help mitigate any discrepancy between my data collection methods and ones that RTD may use to track when a train arrives or departs from a station.
- I considered the real time data to be “accurate” if it was within 1 minute (plus or minus) of reality.
- I considered trains that departed the station 1 minute before the scheduled time to be “on time”, but if the train departed 2 or more minutes before the scheduled time, I considered it to be “early”.
- I considered a Total Difference (Impact) time of 1 minute to be “on time”. Anything 2 minutes or greater was categorized as “late” which negatively impacted the reliability percentage.
Final results
- 36% of the rides were on time
- Real-time data had an accuracy of 84%
- Fare was checked during 12% of my rides
- 4% of the trains didn’t show up at all
- 2% of the trains left the station more than 1 minute before the scheduled time
- 20% of the rides were late 4 minutes or more
- Not a single ride (0%) had an on-train or station announcement regarding delays or issues with the system
So what am I trying to say? As a growing metropolis, we need more reliable transit. With fare increases, route cuts, and new lines opening, it is completely unacceptable to have a transit system that does not reliably move, or notify people. Personally, I would never switch to driving to work as it would double my commute time; however, those with shorter commutes might give up on RTD and drive instead. This is not the result we would like to see.
If we want to solve our traffic issues and gain ridership on our transit system, reliability needs to be the foundation and, based on my survey, RTD is doing a poor job delivering on it. I hope this assessment will encourage RTD to do better.
We don’t just deserve better transit, we needed it yesterday.


