How Denver’s Seminal Planning Document Has Shaped Neighborhoods So Far
A lot of Denver’s neighborhoods look the way they do today because of “Blueprint Denver,” the first citywide effort to integrate neighborhood development and transportation.
Plans like this matter. It makes more sense to build dense housing, retail, and office space in walkable areas near good transit than in unwalkable transit deserts that encourage driving to work or for daily errands. Conversely, high quality transit and walking infrastructure should serve existing areas where lots of people live and work. These things don’t happen by accident.
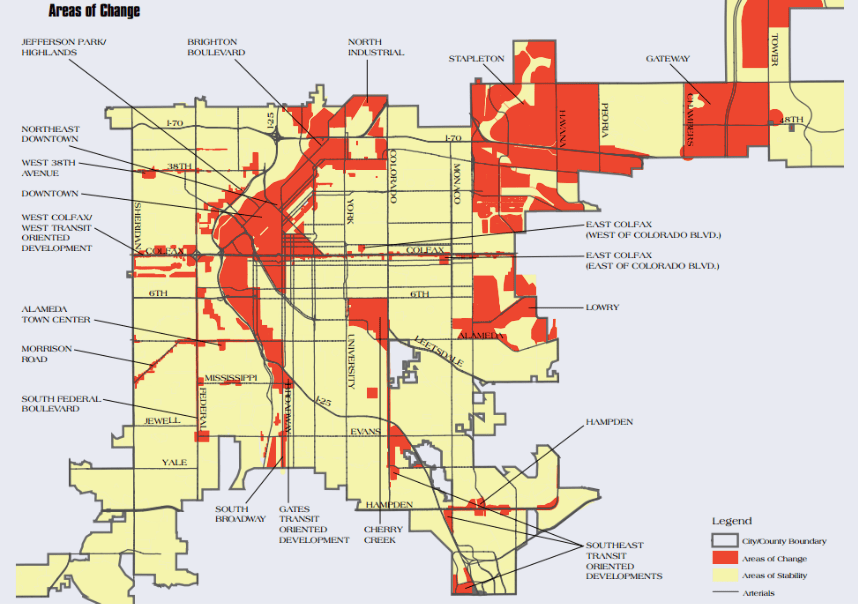
Starting in 2002, the Blueprint document aimed to funnel Denver’s inevitable growth into two types of places: “areas of change” and “areas of stability.” Over the next 15 years city planners would use zoning regulations, infrastructure improvements, and leverage things like urban renewal districts to shape neighborhoods.
Blueprint was intended to guide Denver to 2020. So how is it working so far?
More Homes, Not As Many Jobs.
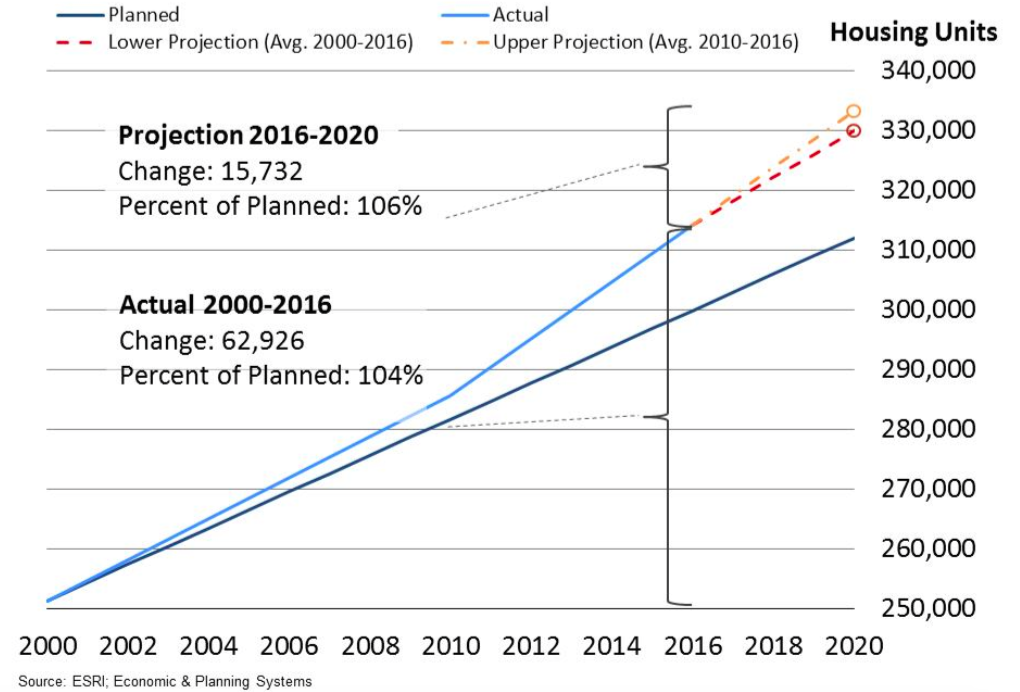
Jobs drive growth and growth creates jobs. While Denver has added a lot of jobs, planners thought there would be more by now (thanks, recession). On the other hand, Denver has added way more homes than expected — even though it’s not enough to satisfy demand.
That’s according to Economic and Planning Systems. EPS analyzed Denver’s growth as part of the Denveright planning initiative, which includes an update to Blueprint, and presented the findings last week during a Denveright meeting focused mostly on homes and job growth.
Blueprint projected 60,700 new housing units by 2020. About 63,000 have already been built, and EPS predicts between 20,000 and 25,000 more by 2020:
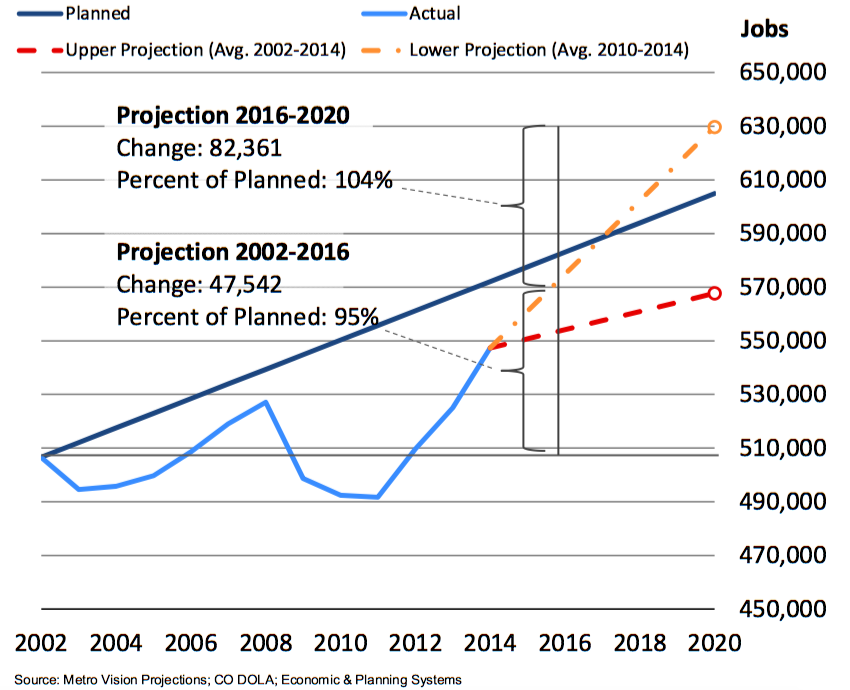
Blueprint predicted 109,200 new jobs by 2020. As of 2014, 40,750 had been created. Job growth has been stronger more recently, according to EPS. At this rate, job growth will exceed projections, but could also finish below or right around the 2020 target:
Do Neighborhoods Have a Good Mix of Homes and Jobs? Depends.
It makes sense for land use to mix places to live with places to work and play. That grocery store three blocks from your apartment? It’s not only convenient for you — it’s a place of work for others. Same with that restaurant or music venue. Have new homes been developed where new jobs have thrived? Depends on where you look.
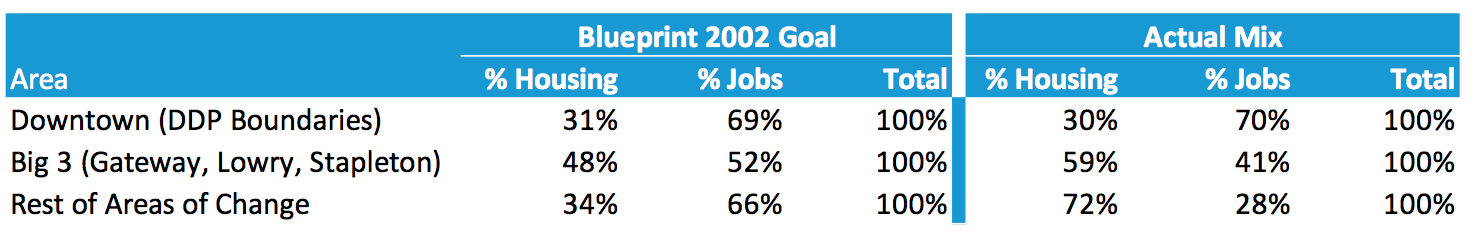
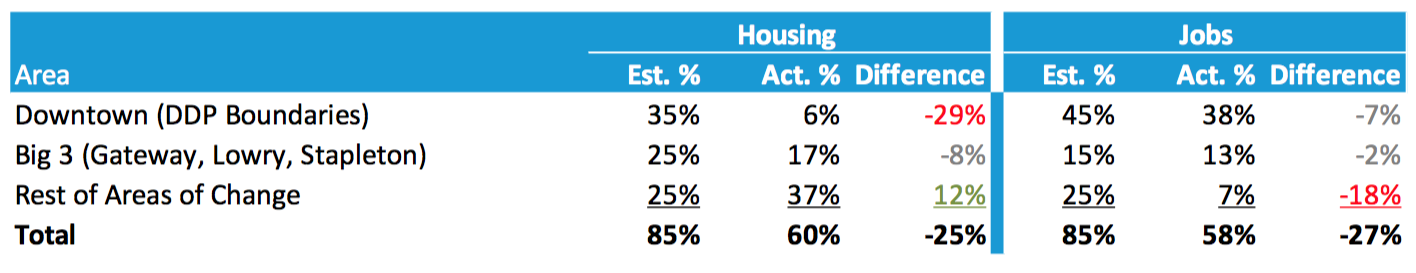
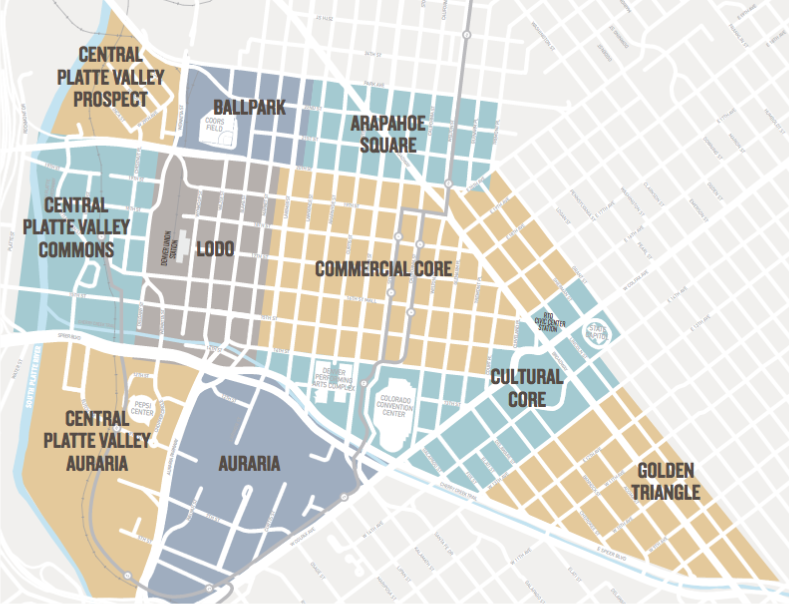
This chart shows that housing and job growth downtown has resulted in a 70-30 split — almost exactly what planners projected. (Downtown is defined on this map from the Downtown Denver Partnership)
In Gateway, Lowry, and Stapleton, neighborhoods that planners thought were especially primed for development, there’s a 60-40 split — more housing than jobs. Planners envisioned more of an even split there.
The mixture in the rest of Denver’s neighborhoods primed for development? Way more disparate. Planners aimed for these neighborhoods to be 34 percent housing and 66 percent jobs, but reality flipped that script. The actual mix is 72 percent housing, 28 percent jobs. These numbers include booming neighborhoods like Highland, Lower Highland, River North, and Berkeley — and there’s still a housing shortage citywide.
Housing and Job Growth Did Not Fit Neatly Into Areas of “Change” and “Stability,” Which Are Problematic Labels.
Planners wanted 85 percent of new homes to be built in neighborhoods of “change” and just 15 percent in neighborhoods of “stability.” That didn’t happen.
Instead, areas of change absorbed between 55 and 65 percent of new homes while areas of stability absorbed 37 percent — though EPS predicts that share will fall to 15 percent by 2020.
Blueprint also aimed for 85 percent of job growth to occur in areas of change, but that figure is actually between 50 and 65 percent. Areas of stability absorbed 42 percent of new jobs.
But here’s the thing: These “change” and “stability” labels are too black and white. Several people at last week’s meeting pointed out that the term “area of stability” became a “weapon” that residents used to stifle multifamily and affordable housing in their neighborhood. “Stability” was never meant to be an anti-growth term, according to the original plan. It was supposed to denote neighborhoods where preserving character was key, but so was some new development and redevelopment — of a rundown commercial center, for example.
Others said the labels did not account for equity — most areas of change have also been predominately low-income or minority neighborhoods, they said, which did not seem to be a concern of the first Blueprint.
Have New Development and Transit, Biking, and Walking Been Complementary?
The analysis on transportation — whether enough dense housing was built near good transit to discourage driving, for instance — will require an in-depth discussion at the group’s next meeting in October, according to city planners.
Streetsblog has migrated to a new comment system. New commenters can register directly in the comments section of any article. Returning commenters: your previous comments and display name have been preserved, but you'll need to reclaim your account by clicking "Forgot your password?" on the sign-in form, entering your email, and following the verification link to set a new password — this is required because passwords could not be carried over during the migration. For questions, contact tips@streetsblog.org.


